Fig. 3

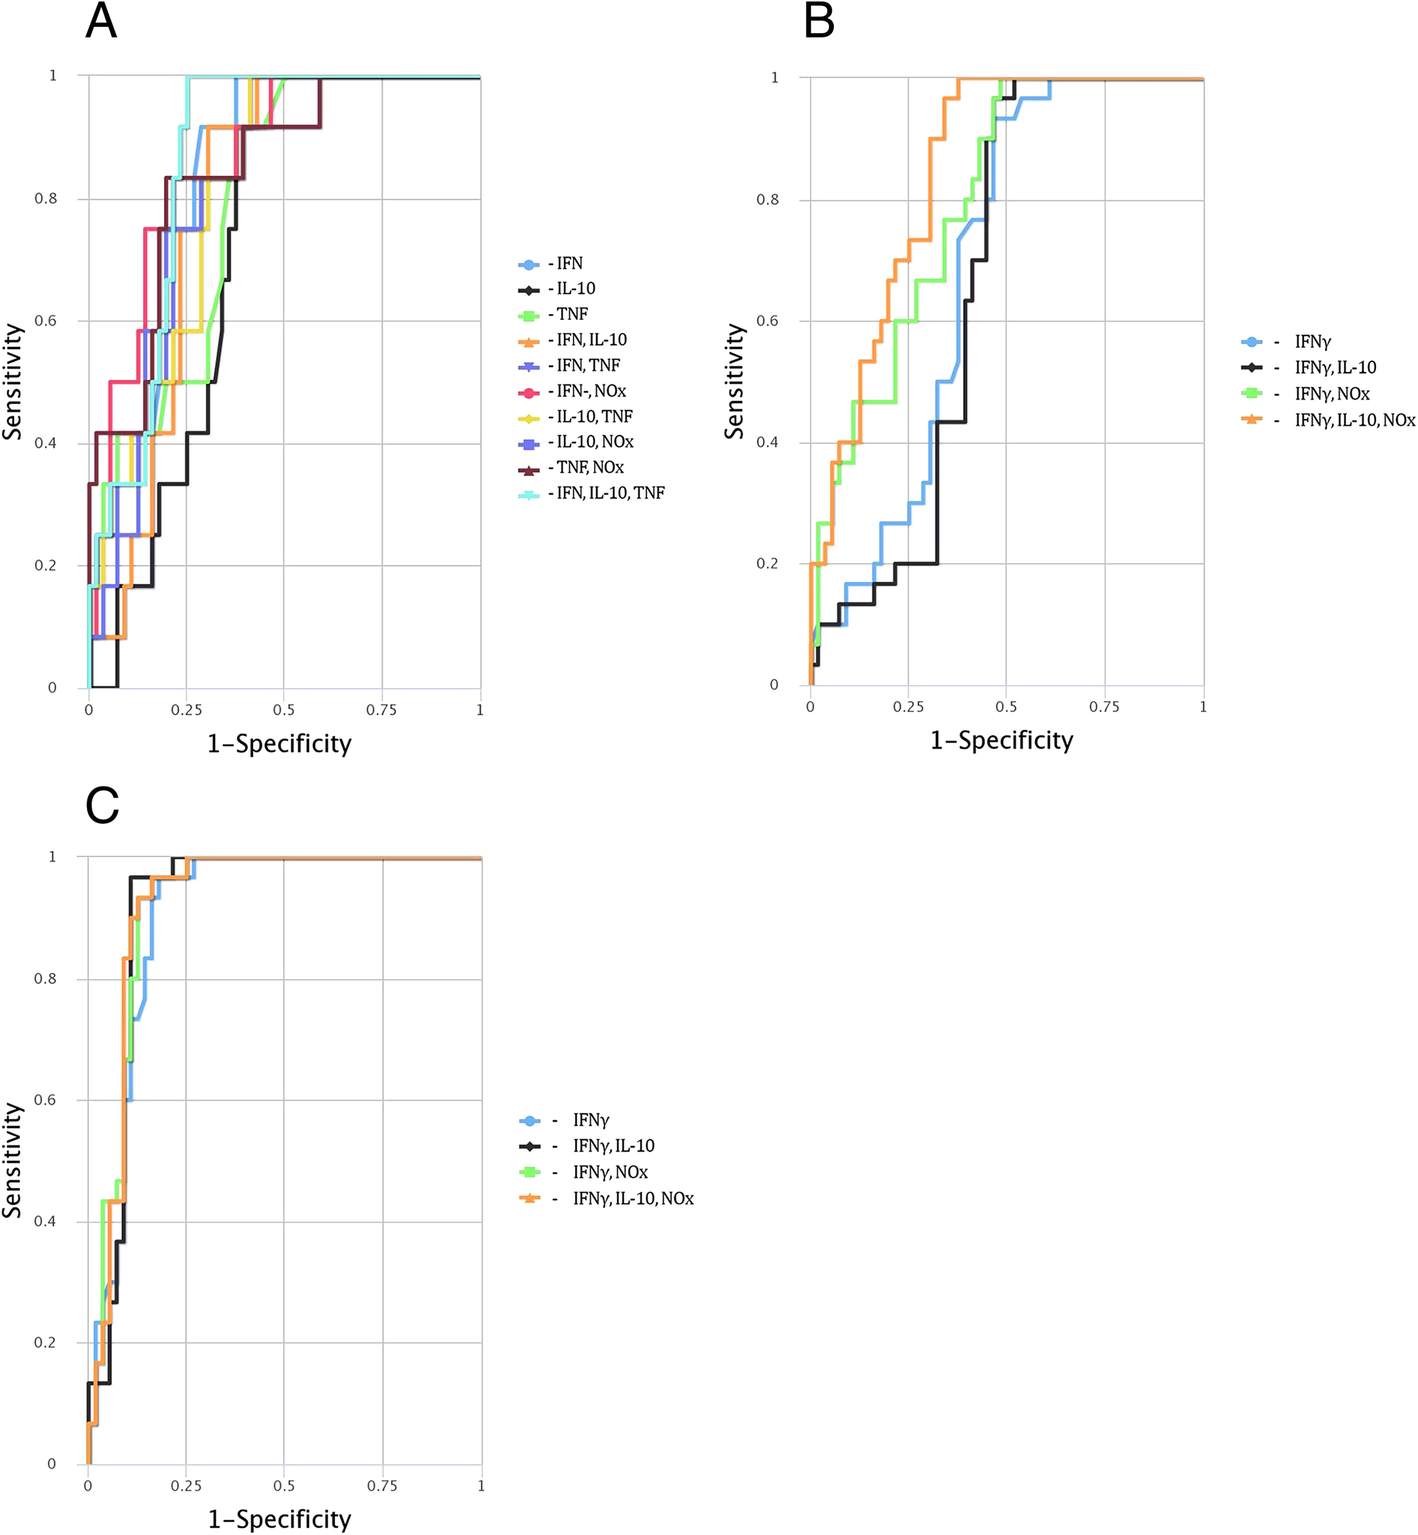
ROC curves for comparing multiple markers and their combinations in PD groups of varying durations.(a) less than 1 year PD, (b) 1–3 years of PD and (c) 3–12 years of PD. ROC curve depicts true positive rate (sensitivity [SE]) on y-axis as function of false positive rate (1 – specificity [SP]) on x-axis. Higher y values correspond to higher SE, whereas lower x values correspond to higher SP